It is intuitively obvious that the result of modeling are mainly influenced by factors used in the above equations. As seen above, these ratios, determined for each sex, depend not only on time but also on age and can vary widely. Therefore, the definition of functions describing mortality and fertility, is an important task. Let's consider a method for assessing change in mortality over time in each age. For this we compare the probability of death for each age for a given period of time.
The probability of death at the age (a) year (t) we obtain as:
Where lx(s,t) – those surviving in sex (s) to age (x), as under survival table in year (t)
changes in the probability of mortality for year we define as follows:
Furthermore, projecting the resulting value, expressed as a percentage of age-time plane, we obtain the field of mortality for a particular sex. Vertical scale - a percentage change in the probability of death. Black color corresponds to the increase in the probability of death, white - reduction. Background color applies to annual fluctuations in mortality percentages in the range of +/- 5%, which corresponds to the average values of positive and negative values of percentage changes in probabilities of death.
Figure 1 such field of mortality given for Russian women during the 1960-2006. . The vertical axis is the age, horizontal - the time, triangles mark the line of life expectancy at birth.
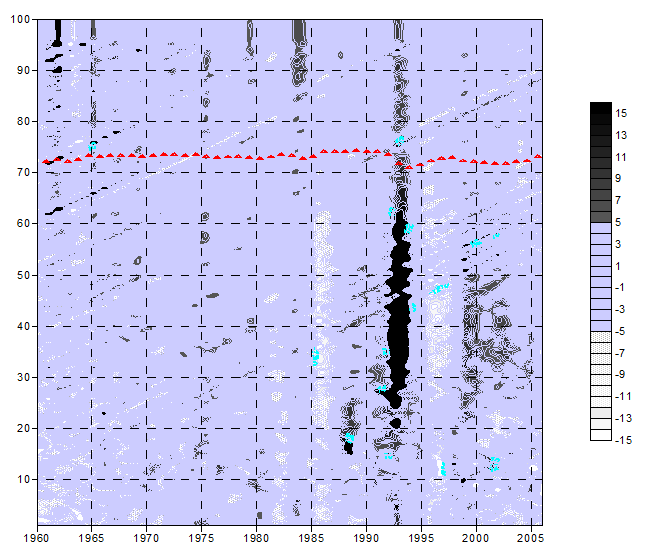
Field of annual changes in probability of death (Source: mortality tables for the period 1990-2007. ANO “Russian Statistics”)
Such presentation of data allows to evaluate the changes in the mortality ratios during a period of time and outline age groups, that are most effected by such changes.
Seen dependence between historical events allows to conclude the preservation of history in the new digital format, media for which are the mortality tables.